Introduction
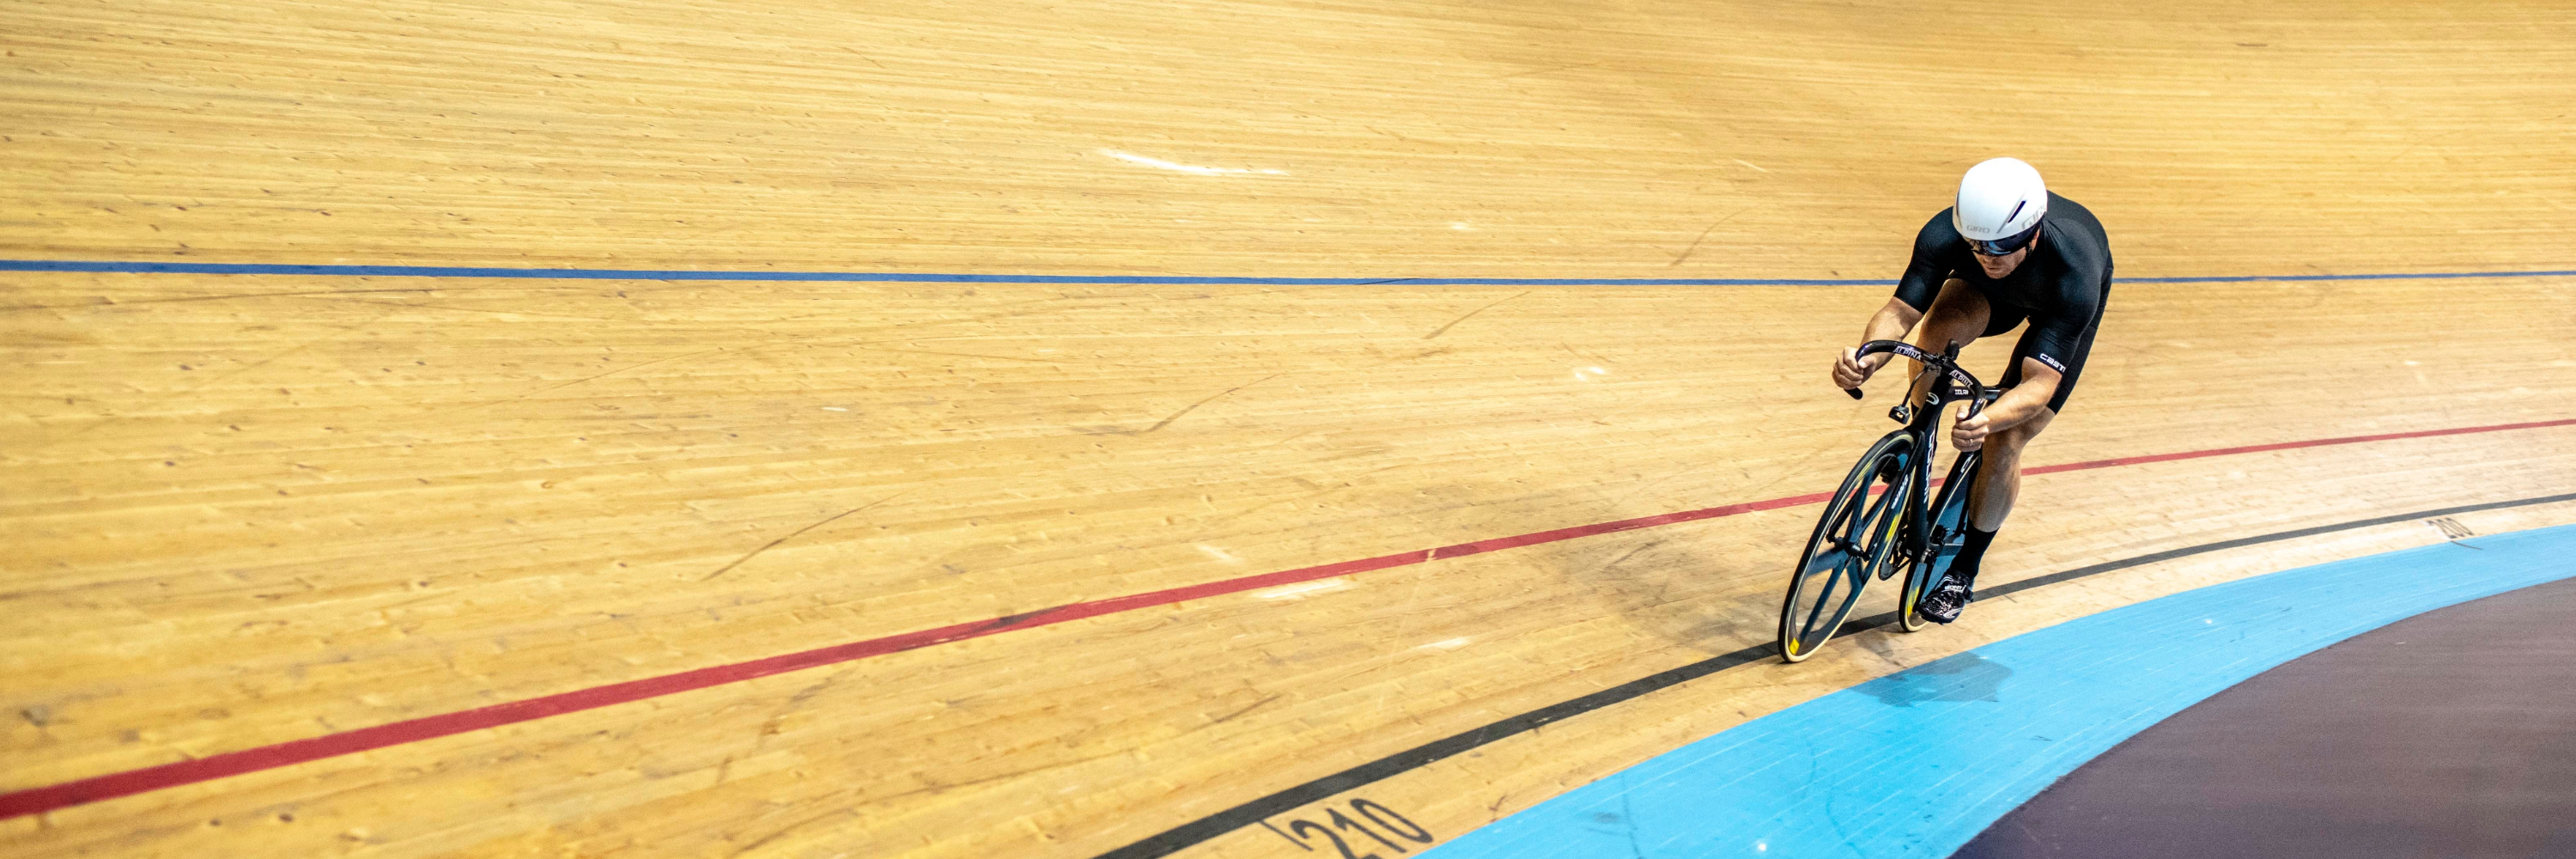
How can we help in the quest for speed? We recently supported a rider who is working towards the 100km Velodrome world record. The goal was to help him be as efficient as possible and provide actionable insights around the understanding of where the best aero to power position is on the bike which was fundamental to meeting this goal.
In this article we look at the comparison of the Endura Drag2Zero skin suit and Overshoes vs baseline cycling shorts and jersey. The barometric pressure was perfect for some fast rides sitting at 998 hPa so it was set to be an interesting test and the Aerodrome lap trigger was used to synchronise lap data with track position, and show the rider live lap CdA and laptime.
The aerosensor drag measurement and aerobody position units were installed on a Dolan DF4 track bike with Prime noosa base bar and Deda Jet aero bars in the praying mantis position as shown in Figures 1a and 1b.

Figure 1a: Track bike with aerosensor and aerobody fitted.

Figure 1b: Track bike with aerosensor and aerobody fitted.
The rider said that from previous testing they expected a CdA of around 0.22, and they had read in other wind tunnel-based test studies that the Endura Drag2Zero skin suit could reduce this by around 10%, which, in this case, would result in a reduction of power of around 25W to maintain the same speed.

Figure 2a: Rider in baseline clothing

Figure 2b: Rider in Endura Drag2Zero skinsuit.
Test
The rider did around 20 laps in each configuration as this was part of their training program. The data presented below is not adjusted in any way from what was displayed on the Garmin bike computer using the aerosensor Connect IQ app.
The aerosensor was used in “Velodrome tracked” mode, which assumes a constant elevation, and uses aerodrome to synchronise lap position with a user-programmed track map to correct for track curvature.
Results
The data below shows lap-average data for each lap (around 20 seconds) of the two runs. No post-correction has been made and this data shows what the rider would have seen on the Garmin computer.
The solid “Non-aero” lines refer to the baseline clothing and the dotted “Aero” lines are for the skin suit. The data shows lap-average CdA, chest position, and head position.

Figure 3: Skin suit vs baseline clothing results.
The data is very consistent, with a standard deviation CdA of less than 0.002 on the baseline run, and 0.004 with the skin suit.
The reduction in aerodynamic drag is very clear at around 10%, which is inline with expectation. However the aerobody sensor shows that the Endura skin suit is forcing the rider lower, by around 1.5cm at the head, and 2cm at the chest.
| CdA | Head (cm) | Chest (cm) | ||
| Baseline | 0.228 | 30.7 | 36.7 | |
| Skin Suit | 0.205 | 28.6 | 35.3 | |
| Delta | -0.022 | -2.07 | -1.46 |
Figure 4: Run-average results
Conclusions
The rider commented that the Endura skin suit did force him into a lower position so this result made sense. We did not have time for further testing but this result leads to obvious questions – how much of the drag loss is due to the lower position? If the lower position is significant, what scope is there to lower the rider further but where will the sweet spot be in which the rider can still maintain the required power but also obtain the optimal aero position? Real-world tests like this enable us to explore this linked dynamic which is quite difficult to reproduce in the wind tunnel.
We plan to explore this further to find the sweet spot and with this being a real-world test we add in the following dynamics, time, power and CdA. From these we can find the optimal setup for this rider on the track for his record attempt.
